The Segregation Model | Variations on the Basic Segregation Model | Preferences for Both
- Source Code for Preferences For Both Dislike model (648 KB)
- Source Code for Preferences For Both Like model (645 KB)
- Shapefile (5 KB)
The previous models have all focused on agents wanting to be in an area where at least a certain percentage of the neighbouring agents are of the same type as themselves with no consideration of the other group. This section will explore how the pattern of segregation alters if an agent has preferences for its own group and for another group. The models presented below could therefore be considered more Sakoda-type (1971) than that Schelling-type (1971) of model. In both instances, the only thing that was changed was what makes the agent satisfied.
The first model (see segModelPreferencesForBothDislike model for more details) explores situations where agents want to live in areas where they dislike too many of their own type and want a greater percentage of another group (Figure 1 or evaluateAndSetHappiness method in Resident Class). The second model (see segModelPreferencesForBothLike model for more details)explores situations where agents have a liking for a certain percentage of their own group and a certain percentage of the other group (Figure 2 or evaluateAndSetHappiness method in Resident Class).
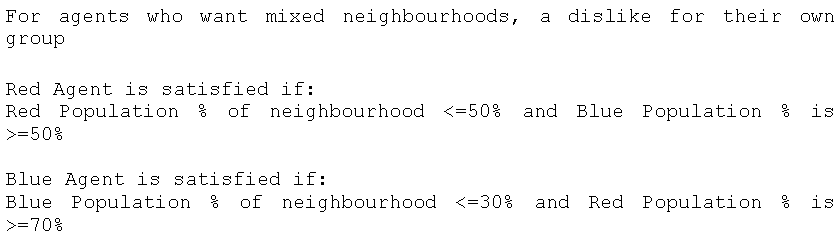
Figure 1: Pseudo-code for basic rule of satisfaction where agents have a dislike for their own group.
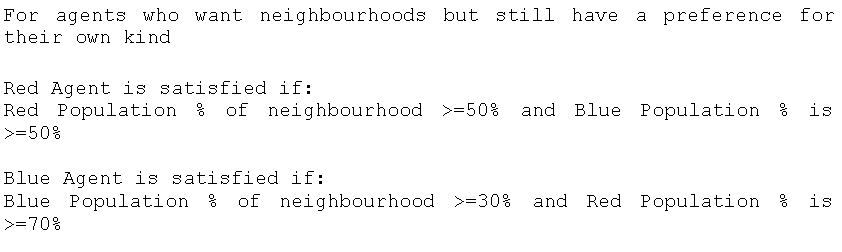
Figure 2: Pseudo-code for basic rule of satisfaction where agents have a liking for their own group.
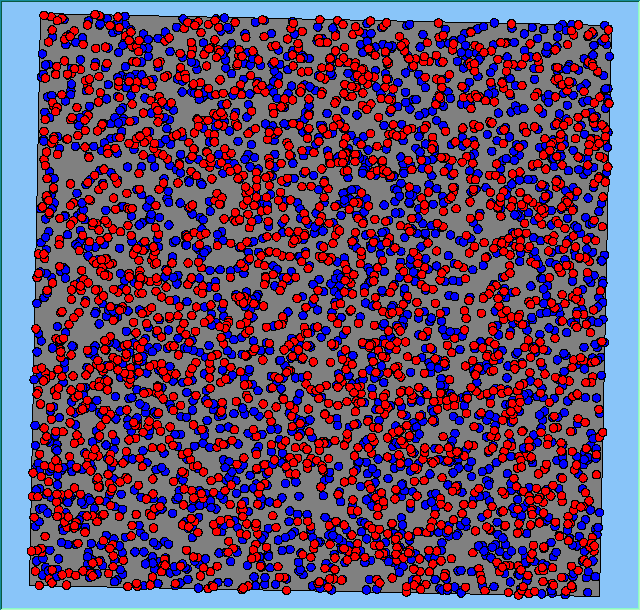
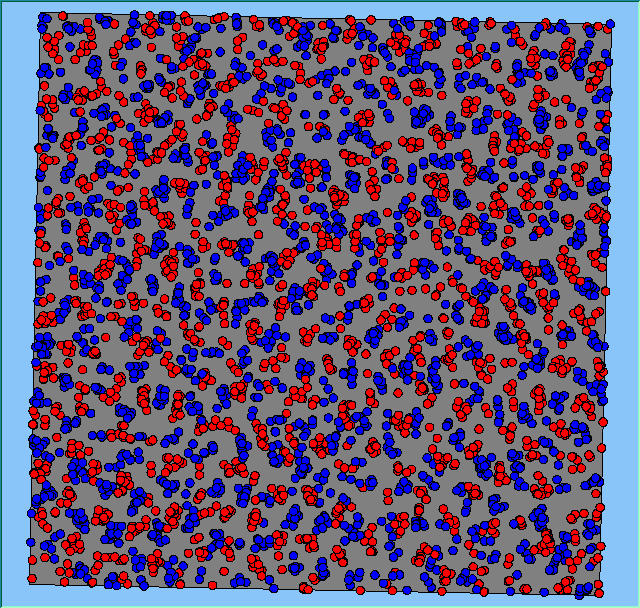
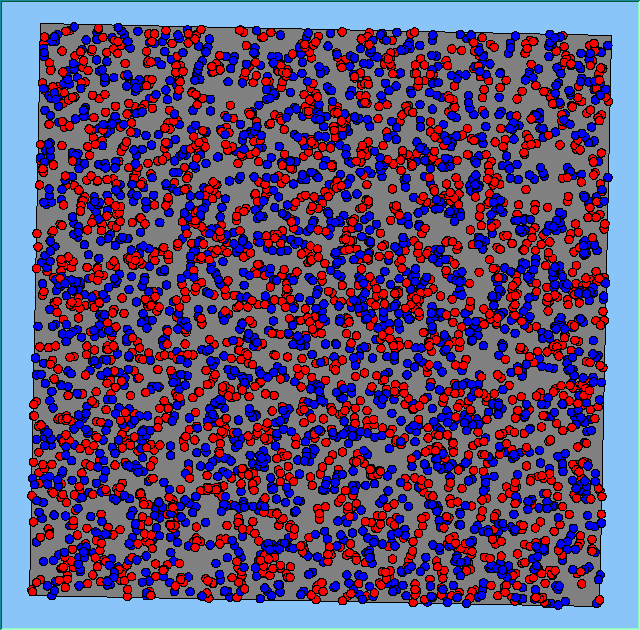
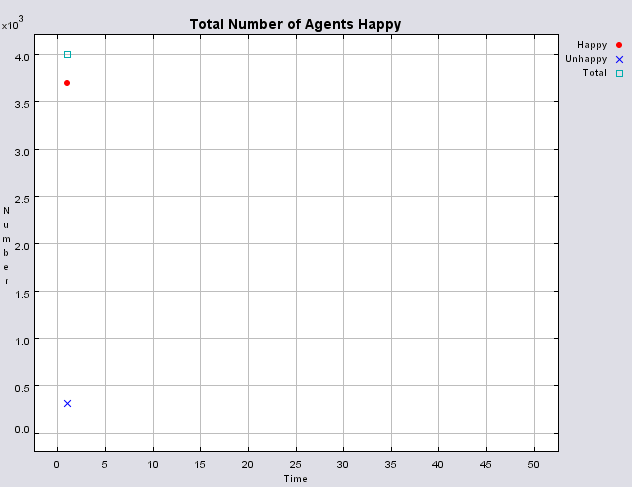
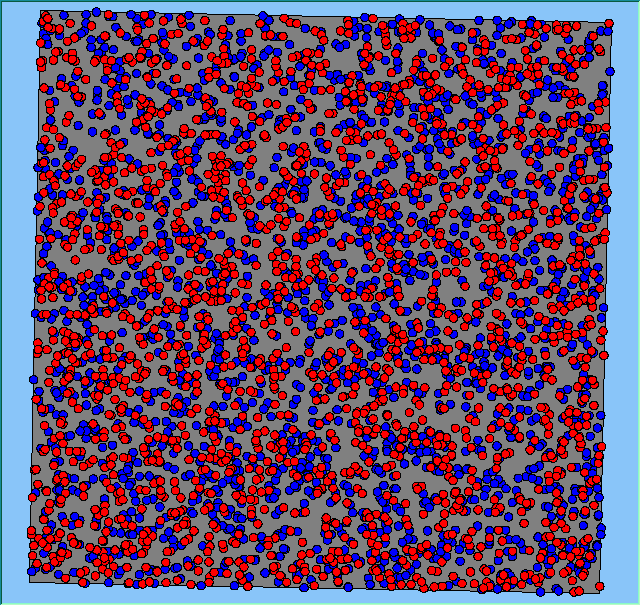
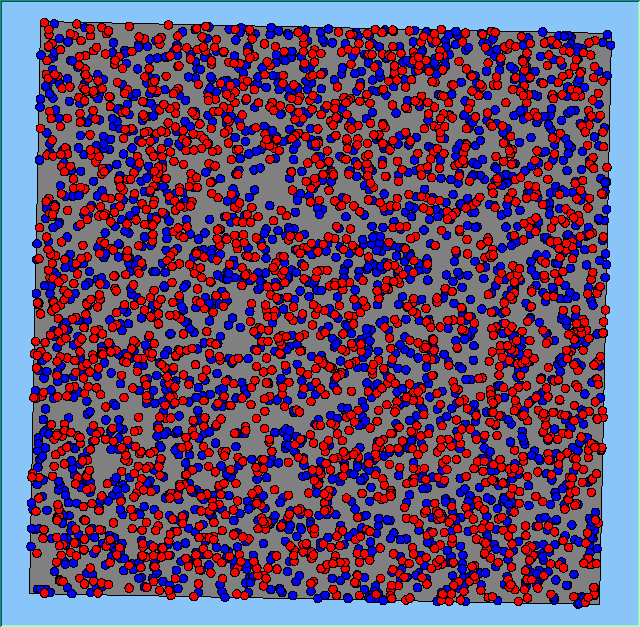
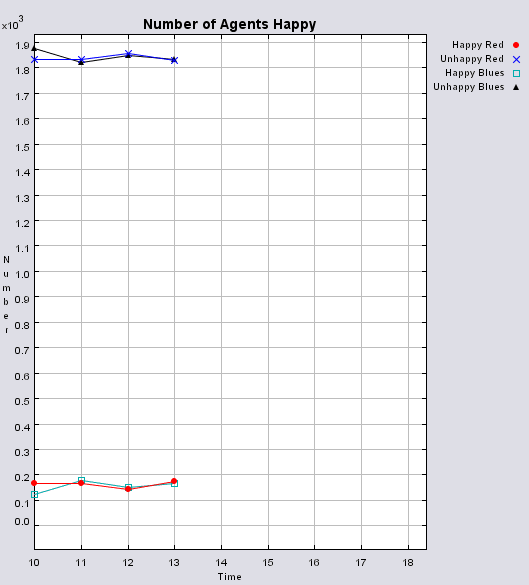
For both models, a 1.5km2 area was used with 4000 agents, with equal numbers of reds and blues and the neighbourhood and movement parameters both set to 100m. Various simulations were carried out with different preference ratios for neighbourhood composition. For agents that have a dislike for their own group, three combinations are presented below (Figure 3), for agents who want neighbourhoods of less than 30, 40 and 50% of their own type and the corresponding value or higher for the other type. By specifying these tolerances, the pattern of segregation becomes less an artefact of the model can be seen which is related to the agent’s movement when searching for a new location. If after their initial random searching, they are still dissatisfied, the agent moves to their nearest neighbour of the same type. This results in agents clustering with their own type within a wider mixed area as highlighted in Figure 3 (Animations of the system evolving where agents want <= for their own type and >= for the opposite type can be seen below). Furthermore, if the tolerance for one’s own group is set to low, agents are removed from the system and a greater number of agents move during the course of a simulation run (Table 1).
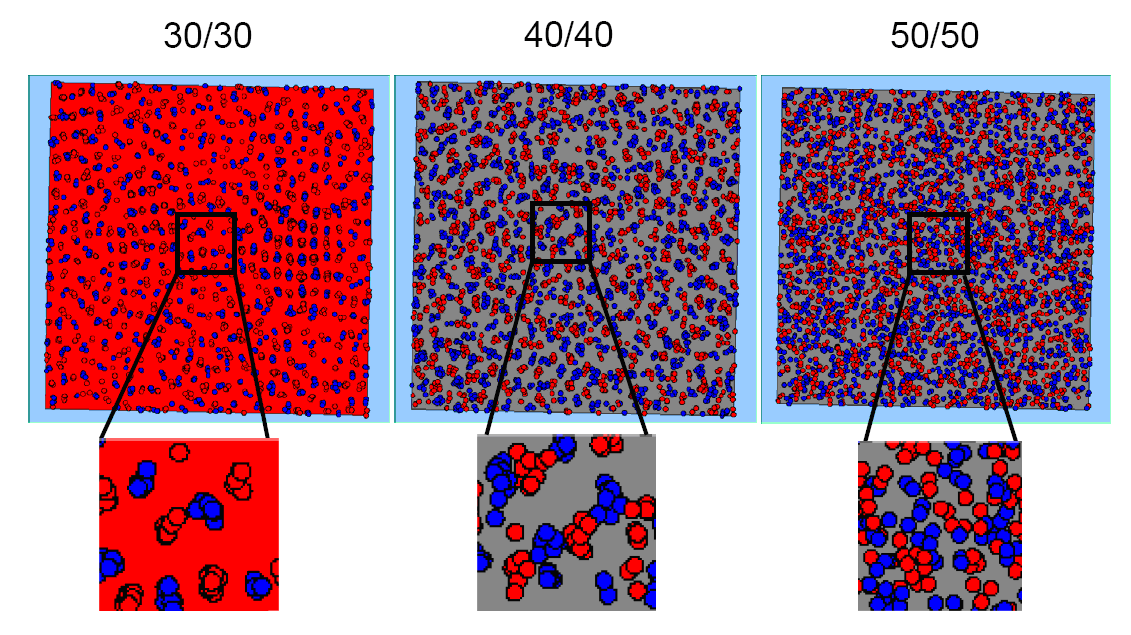
Figure 3: Final patterns of segregation where agents want <= of their own type and >= of the opposite type.
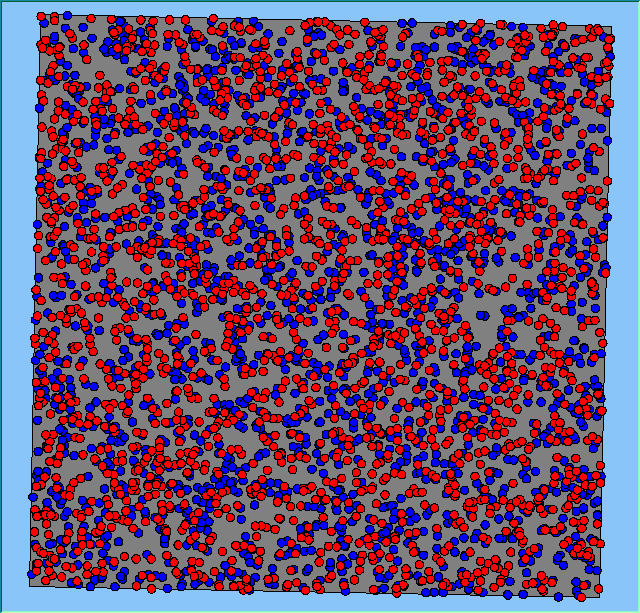
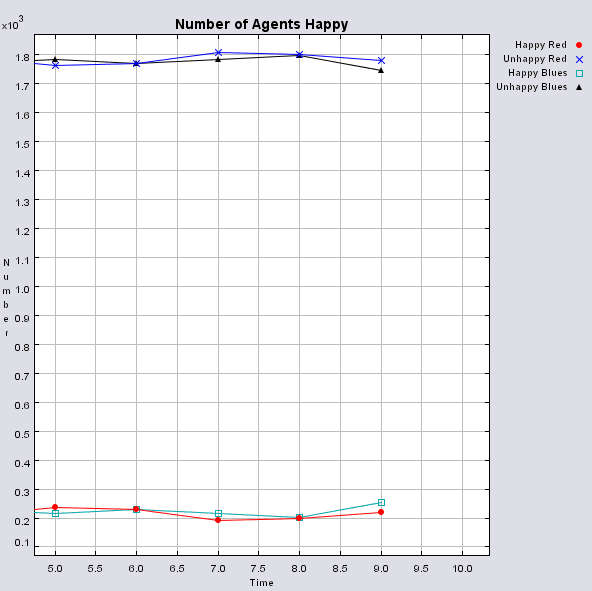
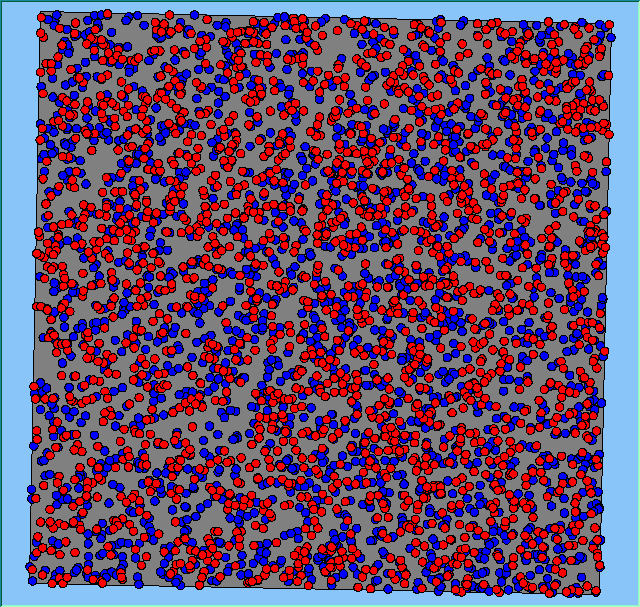
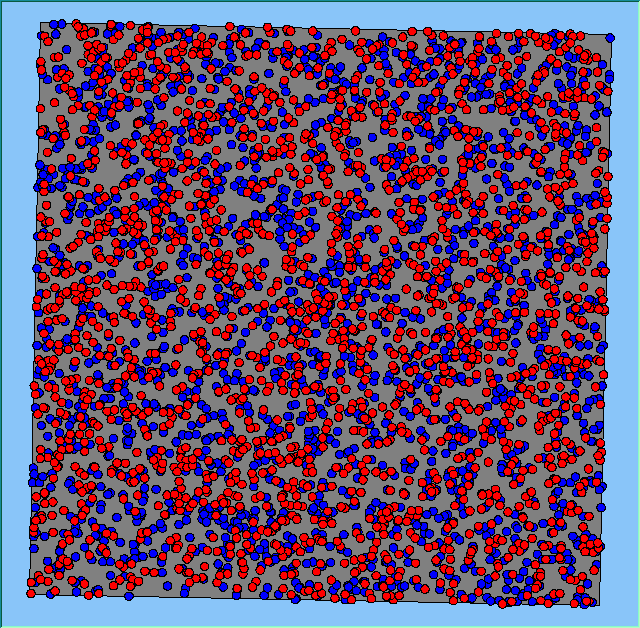
By comparison, if agents want to live in an area where their neighbourhood is composed of more than a certain percentage of their own group and more than a certain percentage of another group, this leads to different patterns of segregation emerging (Figure 4). (Animations of the system evolving where agents want >= for their own type and >= for the opposite type can be seen below). Specifying neighbourhoods of 50% of each type, the model does not stabilise due to the nature of one agent moving to a neighbourhood where all the agents are satisfied and then disturbing the balance. However, during the course of these simulations no agents were removed. At the other extreme if the agent wants an area where at least 30% of the neighbours are of the same type and 70% are of a different type, this leads to agents concentrating in the centre of the area and being removed from the system, as a result of neighbourhood change due to agents moving throughout the course of a simulation run.
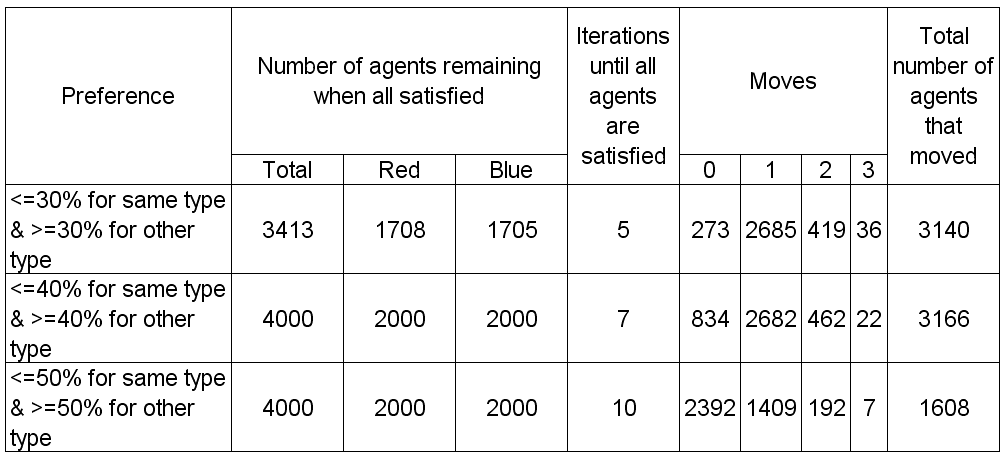
Table 1: Summary statistics segregation where agents want <= of their own type and >= of the opposite type.
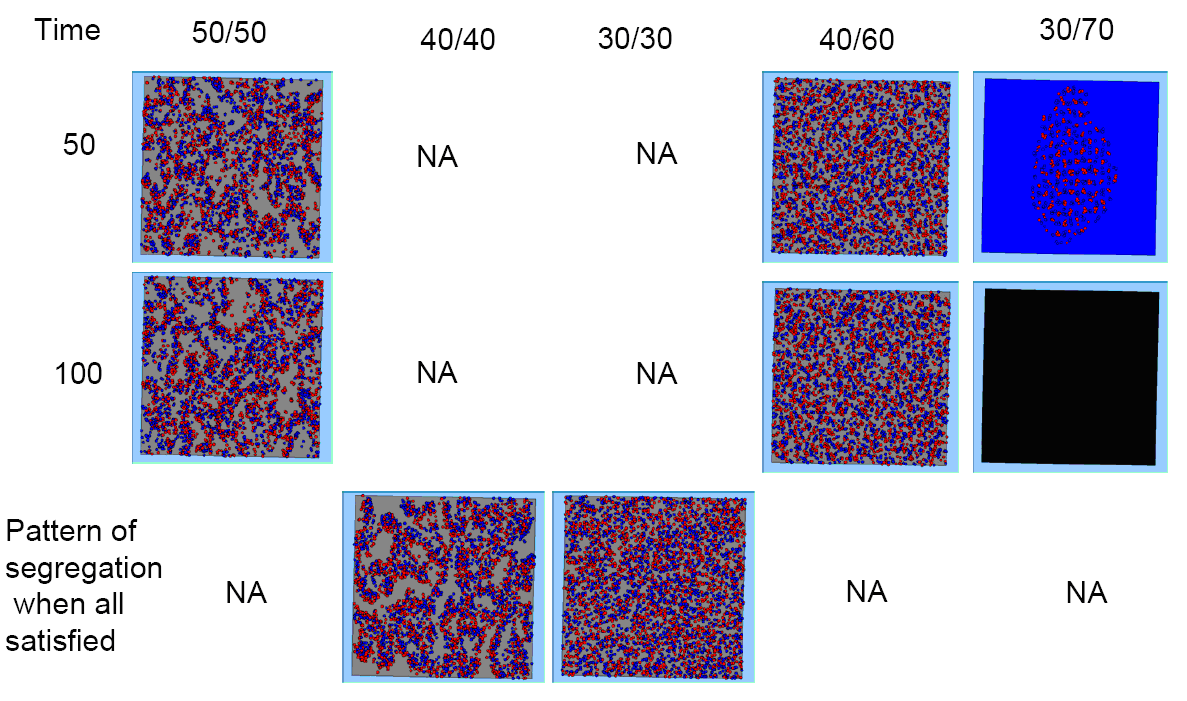
Figure 4: Final patterns of segregation where agents want >= of their own type and >= of the opposite type.
Animations of the system evolving where agents want <= for their own type and >= for the opposite type.
 |
 |
 |
 |
 |
 |
Animations of the system evolving where agents want >= for their own type and >= for the opposite type.
 |
 |
 |
 |
 |
 |
 |
 |
 |
 |
References
Sakoda, J.M. (1971), 'The Checkerboard Model of Social Interaction', Journal of Mathematical Sociology, 1: 119-132.
Schelling, T.C. (1971), 'Dynamic Models of Segregation', Journal of Mathematical Sociology 1: 143-186.