The Seg Model | Variations Segregation Model | Different Numbers and Different Types of Agents
Sections: Four Types | Adding & Removing | Preferences for Groups
- Source Code for Segregation four types (799 KB)
- Shapefiles for all the simulations below (55 KB note: individual shapefiles will be highlighted where relevant)
Reality is much more complex than that of Schelling’s (1971) original model. While Schelling’s model of residential tipping is well known to students of residential mobility and segregation, it is seldom directly used to analyse neighbourhood change in real populations (Bruch and Mare, 2005). To be used for this purpose, the model needs to address several issues, specifically the limitation of only using two groups. For example within London, there are numerous different types of ethnic or socioeconomic groups living within one area. While the previous models in this section have given insights into segregation, they have only explored what occurs when there are only two types of agents in the system.
Therefore a variation of the basic segregation model was created which allows one to explore relationships between several different racial or socio-economic groups. These new models incorporate specific aspects of previous models presented in this website, specifically the addition and removal of agents (see The Adding and Removing of Agents). The model (for more information see the segModelFourTypes model) allows for four different groups/types of agents but this can easily be extended to any number of agents if desired. In this case, the agent belongs to one of the following groups: white, red, blue or green; however, these could be social or ethnic groups if the model was applied to a real situation. Each agent has a preference for levels of residential contact (co-residence) with members of different groups. Included are preferences for in-group contact, specified in terms of desired minimum levels of co-ethnic presence in neighbourhoods. The ability to add and remove agents of numerous groups can therefore form the foundation to studying and exploring how residential dynamics (such as immigration) affect the pattern of segregation seen within urban areas.
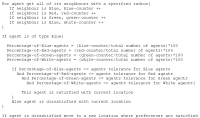
To create this model, extra fields were added to the shapefile to represent different social groups (e.g. WHITE and GREEN which relate to the getWHITE and getGREEN methods in the UrbanAgent Class), thus providing the ability to set the number of agents at the start of each simulation and the basic segregation model was extended to allow for rules governing agents’ preferences to incorporate these different possible new combinations of neighbourhood (see Figure 1 and compare the evaluateAndSetHappiness methods in the Resident Class for both the basic segregation model and the segModelFourTypes). It is assumed that agents have a positive preference for their own group and a negative preference for other groups. The following subsections will explore the effect of four types of agents and the patterns of segregation that emerge.
Figure 1: Pseudo-code for blue agents evaluating their neighbourhood when there are four types of agents.
The Effect of Four Types of Agents
First we will explore how the pattern of segregation emerges when there are four groups (reds, blues, greens and whites) in a single area (1.5km2). Within the area, 4000 agents were randomly placed, 1000 in each group. As in previous simulations, all agents wanted to be in a neighbourhood where 50% or more of its neighbours are of the same type. This preference value was chosen as previous model runs highlighted how clear patterns of segregation emerge with this threshold. Neighbourhoods were set at 100m so that the model results could be compared to those of multiple model runs of the basic segregation model (see Multiple Model Runs).
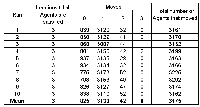
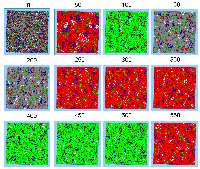
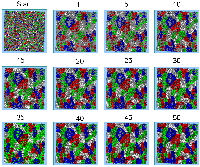
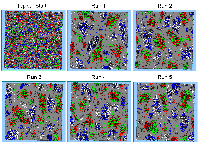
As one would expect from the exploration of previous model runs, clear patterns of segregation emerges but their precise patterns vary as the agents interact and move about the system until they find an area where they are satisfied with (Figure 2). However, surprisingly, the mean number of iterations until all the agents in the system are satisfied is less than those when only two agents are present in the system (see Table 1). This relates to the number of moves that agents make throughout the simulation. Within this model, more agents move throughout the course of a simulation run than when there are only two types of agents, especially the number of agents that move once (see Table 1 and Table 1 from Multiple Model Runs). However, in the basic segregation model when there are just two types of agent, agents move more on average 2 and 3 times during the course of a simulation. This is a result of many agents being dissatisfied with their initial neighbourhoods and it is this initial movement in the first step as shown in Figure 2 that results in the pattern of segregation emerging and persisting over the course of the simulation until all agents are satisfied.
Figure 2: A typical pattern of segregation when all agents search for neighbourhoods which they are satisfied with.
Table 1: A selection of model runs when four types of agents are introduced into the system.
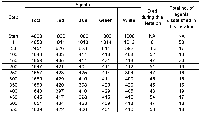
Once the spatial pattern of segregation emerging from four types of agents had been explored, a second experiment was carried out. This experiment used the same preferences and parameters as the previous experiment except that 50 agents are added (each new agent is given a random age between 1 and 64) each iteration and removed if they reach the age of 65. Figure 3 highlights a typical pattern of segregation whereby clusters appear and disappear over time as agents are added and removed. Table 2 provides descriptive statistics on the average composition of the simulation during a series of time steps. As the simulation advances, initially the number of agents decreases as more agents die than are being added. However over time the population stabilizes at around 1600 agents and the number of dissatisfied agents ranges between 13 and 20.
Figure 3: Typical evolution of segregation with clusters changing over time as agents are added and removed (Click here to see animations ).
Table 2: Average number of agents from multiple model runs as agents are added and removed.
The Effect of Adding and Removing Agents
- Single Area with four types of agents shapefile used in this section (5KB)
- Single Area with no white agents shapefile used in this section (5KB)
- Compex Area no white agents and no empty area (12KB)
- Complex Area no white agents, one empty area (12KB)
- Complex Area 4 types (12KB)
Further analysis pertaining to the addition of agents into the system was also examined, specifically the effect of adding a new group of agents. When there are two types of agents, say red and blue already in the system, and when adding either a new red and blue agent, there are always two types. If these new agents have preferences for their own group they can nearly always become satisfied and stay in the system. However, to explore what occurs when there are four types provides other opportunities. For example, what happens when a new social group is introduced to the system? The first experiment was to see the effects of adding four types of agents during the course of a simulation (200 new agents each iteration where the social group is randomly chosen by the program) with no removal of agents. The model initially had 4000 agents, 1000 of each type. Within this model, agents want to live in areas where 50% of their neighbours are of the same type and neighbourhoods are defined as 100m. By running this simulation multiple times, it becomes clear that the pattern of segregation is self-reinforcing; as distinct clusters emerge, new agents are added reinforcing the clusters of these different groups. Figure 4 shows a typical simulation run highlighting that over time, clusters emerge and persist as new agents are added. After 50 iterations, each group makes up roughly 25% of the entire population and coupled with the average number of dissatisfied agents in each group, are nearly equal (Table 3).
Figure 4: Screen captures at distinct time periods of a typical model run with four types of agents where the patterns of segregation are reinforcing.
Table 3: Average results of multiple model runs where agents have been added to the system containing four groups.
While the experiments in the previous section and above showed how four groups interact, the following experiments examine how a new residential group might be added to the system. The previous experiment highlighted how agents reinforce the pattern of segregation if agents are not removed from the system. In this experiment, we start off with initially three residential groups: red, greens and blue, and then introduce whites during the course of the simulation. Two experiments were run where the new white agents desire a neighbourhood where 50% are of the same type and where whites have no preference for their own group. In each experiment; red, blue and green agents want 50% of their neighbours to be of the same type.
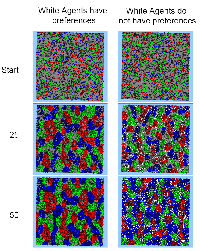
When white agents desire to live in areas where 50% of their neighbours are like themselves, white agents are added to the system but subsequently removed because their preference for the desired neighbourhood configuration could not be met (see Table 4). In the case where the white agents have no preference for neighbourhood composition, they can easily be added to the system (see Table 4). Table 4 also highlights that when white agents are added to the system, they have little effect on the total number of dissatisfied agents after 50 iterations. This is due to the large numbers of other types of agents within concentrated areas, and therefore the percentage of white agents in these areas is relatively small (Figure 5 or click here to see a selection of animations).
Table 4: Average results of multiple model runs where agents have been added to the system originally containing three groups.
Figure 5: Typical patterns of segregation where white have and do not have a preference for neighbourhood composition (Click here to see animations ).
The experiment above highlights that introduction of new white agents find it difficult to get established in an area unless their tolerances for different types of neighbours is high. However, if this rule is relaxed and an agent is allowed to live by itself (The previous models all assumed that agents could live by themselves but due to the density of the neighbourhoods and lack of free space, this could not be achieved. The following simulations specifically have empty space for agents to move to.), can a new group of agents be introduced? To explore this, three simple experiments where carried out. In each case, agents can live by themselves (i.e. have no neighbours) or red, blue and green agents want to be in areas where 50% of their neighbourhood are of the same type as themselves, and 200 new agents are added each iteration and neighbourhoods are set to 100m. The first experiment involved white agents who have a 50% preference for their own group. The second experiment involved white agents with no preferences for their neighbourhoods. In both instances, agents are being added to the same environment with no empty areas. In the third experiment, there is one empty area within the environment and white agents either want to live in areas where 50% or more of their neighbours are of the same type or can live by themselves.
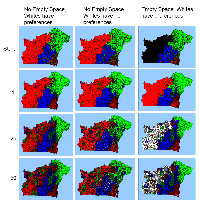
Table 5 highlights the average results of multiple model runs of these three separate experiments. In the two models where white agents have 50% preference for their own group, agents are only added in the model where there is free space. Over the course of the simulation run as agents are added, the free space becomes occupied by different groups but the majority in this area tends to be white. Figure 6 highlights this, with the underlying polygon colour representing the predominant social group of that area (click here to see animations). However, in the model where there is no empty space and the white agents have a 50% preference for neighbours of the same type, white agents are added but removed straight away as they cannot find areas where their preferences can be satisfied. A small number of white agents are also added but then removed in the model where there is empty space (on average this is 4, see Table 5). This only happens in the first iteration of the model and is due to the random placement of agents and how they search for their first location where they will be satisfied (see adding and removing page for information pertaining to adding agents of new agents). This removal of agents in the first iteration has little effect on the end percentages of white residents within the model. For example, after 50 iterations, the average percentage of white agents is 19% where there is free space and they have a preference for their own group, and 18% for the model where white agents have no preferences.
These experiments highlight that new social groups entering the system must either have low tolerances for other groups, or that there needs to be free/empty space where they have no neighbours for the new agents to occupy. In the latter case, over time as more agents enter the system, this empty space fills up and clusters emerge, reinforcing the original cluster of new agents being added to the system.
Figure 6: Typical patterns of segregation where white agents are added to the system (Click here to see animations).
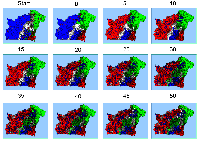
To explore further how the addition and removal of agents affects the appearance of an area, multiple model runs were carried out where the initial population was 3900, composed of 31% red, 28% blue, 21% green and 20% white agents. These agents are spread across the 7 polygons (see the Start screen capture of Figure 7). Reds and blue agents are the predominant social group in 2 areas each, while there is 1 green, 1 white and 1 mixed area. Over the course of a simulation, agents both die (at the age of 65) and are added (500 each iteration). By iteration 50, the composition of the entire area is on average 25% of each group and on average 12352 agents have died. However, on average reds are the predominant social group in 3 areas, greens are the predominant group in 2 areas and blue and white are predominant in 1 area each (Table 6).
Figure 7: A typical pattern of segregated neighbourhoods as agents are both added and removed from the system (Click here to see animations ).
Table 5: Average results when adding agents when there is no space and when there is space with different preferences.
Table 6: Average results when agents are added and removed from the system.
Agents have Preferences for Different Groups
Within the previous models in this section, all agents have wanted to live in areas where at least 50% of their neighbours were of the same type as themselves. Their preferences for other groups were therefore less than 50%. In this section, simulations were run to test how groups might become integrated if a group of agents have a preference for one particular group over the other two. As discussed in the introduction to this section (see above and Figure 1), agents want areas where there is a greater percentage of their own type and less than a certain percentage of another type. In the following simulations, all agents want to be located in areas where at least 30% of their neighbours are of the same type as themselves and have a stronger preference for one group over the other two groups (Table 7). Within all the simulations, a 1.5km2 area was used, populated with 4000 agents, 1000 of each type and neighbourhoods where set to 100m.
Table 7: Agent preferences satisfied in their neighbourhood which contain more than 30% of own type and less than what is specified here.
Several simulations where run until all agents were satisfied with their neighbourhoods. Table 8 provides summary statistics from these simulations. What is of interest is that in some simulations agents were removed because they could not be satisfied. This only occurred in the first iteration of each simulation in cases where agents were removed. As previous models presented in this section used the same space and number of agents, agents were not removed (see above and Table 1). Therefore one can propose that the cause of this removal is due to the random scattering of agents and low tolerances for specific groups. Additionally the comparisons between the number of iterations until all the agents are satisfied and the number of times agents move is also greater when preferences for other groups are introduced. Figure 8 highlights a typical spatial pattern of segregation that emerges for preferences of one group over another (click here to see some sample animations). It is clear that green and red agents cluster and white and blue agents cluster. At the same time, distinct clusters of one type of agent can also be clearly seen as their preferences are still being matched (i.e. more than a certain percentage of their own group and less for the other groups which is an artefact on how the agent searches an area, see Movement in the basic segregation model).
Table 8: Summary statistics segregation where agents have a preference for one other group over the other groups.
Figure 8: Patterns of segregation where agents have a preference for one other group over the other groups (Click here to see animations).
References
Bruch, E. and Mare, R.D. (2005), Neighbourhood Choice and Neighbourhood Change, California Centre for Population Research University of California – Los Angeles, Los Angeles, CA, Available at http://www.stat.ucla.edu/~bruch/NCNC.pdf.
Schelling, T.C. (1971), 'Dynamic Models of Segregation', Journal of Mathematical Sociology 1: 143-186.

