The Segregation Model | Variations on the Basic Segregation Model | Combing Various Models Together
- Source Code for Segregation Four Types Combined (834 KB)
- Shapefiles for the simulations below (21 KB)
The final model (see segModelFourTypesCombined model for further details) to be presented in this section incorporates several aspects of all the other models presented in this website, highlighting how different model components can be easily incorporated into a more detailed model to explore segregation. These include the ability to add and remove agents, setting density limits for agent neighbourhoods, restricting the agents movement in the first iteration to only the area it is currently in and allowing agents to live by oneself. The importance of geographical features has been presented, while it has been highlighted how different preferences can affect the pattern of segregation. By developing these models separately and seeing how each assumption affects the outcome of a particular simulation, a reasonably thorough understanding of the models can be gained, thus reducing the need to carry out unit tests of different parameters.
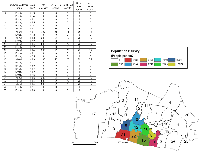
For each experiment, several simulations were carried out. In each case, all started with 2700 agents, 25% of which were white, red, blue and green distributed evenly between 9 mixed areas (300 agents in each area) with 17 empty areas. The total area measured 2.6km2 (see Figure 1). For all simulations, the maximum density for any neighbourhood was set to 12000 people per km2. Each agent wanted to live in a neighbourhood where 50% or more of its neighbours were of the same type as itself. Movement and neighbourhood sizes were set to 100m and the agents’ movement was restricted on the first iteration to the area where it was initially placed.
Figure 1: The test area showing initial population density of the different polygons and the associated attribute table.
Two experiments were carried out, one where agents were only added and a second where agents were both added and removed if they reached the age of 65. In both instances, 200 new agents were added each iteration and the simulations ran for 50 time steps. Both experiments were subdivided between locations where agents could live by themselves and where agents could not live by themselves. Table 1 provides summary statistics of the experiments. It shows that in both experiments, the land-use at the end of the first iteration is similar apart from the number of empty polygons. The number of empty polygons reflects the fact that agents can or cannot live by themselves after new agents are added to the system. In cases where agents can live by themselves, the average number of empty polygons after the first iteration decreases. The number of agents that move from their original area in the first iteration is similar in all cases ranging from 1278 to 1357. This reflects the initial composition of small densely populated areas with an even distribution of population (i.e. 25% of each type). Therefore in certain circumstances agents preferences cannot be met, thus forcing them out of their original area. In both cases where agents are both removed and added, or just added, similar average land-use patterns can be seen at the end of the simulation. Additionally the percentage composition of each type of agent at the end of the simulation reflects that at the start for both addition and removal, and just adding simulations, with roughly 25% of each type. In both experiments, the average number of agents that were dissatisfied after 50 iterations was slightly higher when agents could not live by themselves.
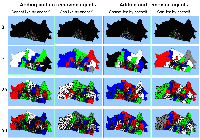
Figure 2 allows for visual comparison of typical model runs for both experiments and their sub-experiments (click here to see a selection of animations). It shows the initial distribution of agents clustered in the 9 mixed areas, the pattern of segregation developing after the first iteration, the 25th iteration and the final iteration. Clearly the ability to live by oneself can be seen at the end of the first iteration after new agents have been added, while agents that have moved and been added cluster around already populated places. Agents that can live by themselves disperse over most of available area. Additionally if agents can live by themselves, clusters of segregation are less noticeable by iteration 50.
Table 1: Average results when combining different variations of the segregation model together.
Figure 2: Typical simulations when combining different variations of the segregation model together (Click here to see a selection of animations).


