The Segregation Model | Models within Paper | Addition and Removal of Agents
- Source Code for Add and Remove Segregation model (656 KB)
- Shapefile (12 KB)
All cities and regions change both by growth and decline. However, Fossett and Waren (2005) note that there is no mechanism of population turnover within Schelling’s basic model, households are ‘immortal’ and thus a satisfied household can reside in the same location for ever. The previous simulations were designed to study how established groups participate in constructing the city’s social-spatial pattern. The following section highlights how an extra layer of dynamics can be added to the more traditional Schelling-type model, through the addition and removal of agents. The ability to add new agents and the death (removal) of older agents is not discussed in Schelling’s original work or is not a topic greatly researched, as most Schelling-like models operate in cellular space where only a finite number of agents are possible depending on the size of the grid used. However, within the model developed here agents are not restricted to one agent per cell. This variation of the segregation model therefore allows one to explore how an area’s social-spatial pattern might change through adding and removing agents, especially how new agents affect the composition of the area. This could be considered as immigration and aging and the death of populations in urban areas. This is similar to the work of Portugali (2000) who simulated how agents could be added to the system and how neighbourhood patterns change due to the additions.
The model (see segregationModeAddRemove model for further information) itself varies from others presented thus far in a number of ways. Firstly all the agents are given a new attribute: ‘age’ (see getAge method in Resident Agent Class). This age is determined randomly between 1 and 50 using a random number generator when the agent is first created at the beginning of the simulation (see randomAge method in Resident Agent Class). At the end of each step (iteration) of the simulation, the agents age increases by one (see agePopulation method in Resident Agent Class). In the previous version of the model, agents’ were only removed from the system if they could not find a suitable neighbourhood. In this version, agents are also removed from the system when their age reaches 50 (see removeResidents method in SegGISModel). The second variation to the model is the addition of new agents at the end of each step. These new agents are first created, given a random social class and an age of 0 and placed randomly in the urban area. The new agent then evaluates its neighbourhood (see Neighbourhood Calculations) and if dissatisfied, it moves to an area where its preferences are met. This new agent uses the same searching and movement criteria as in the basic segregation model (see Movement) and if the new agent cannot become satisfied with the area, it is removed from the system.
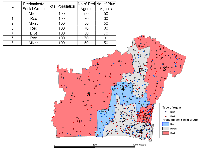
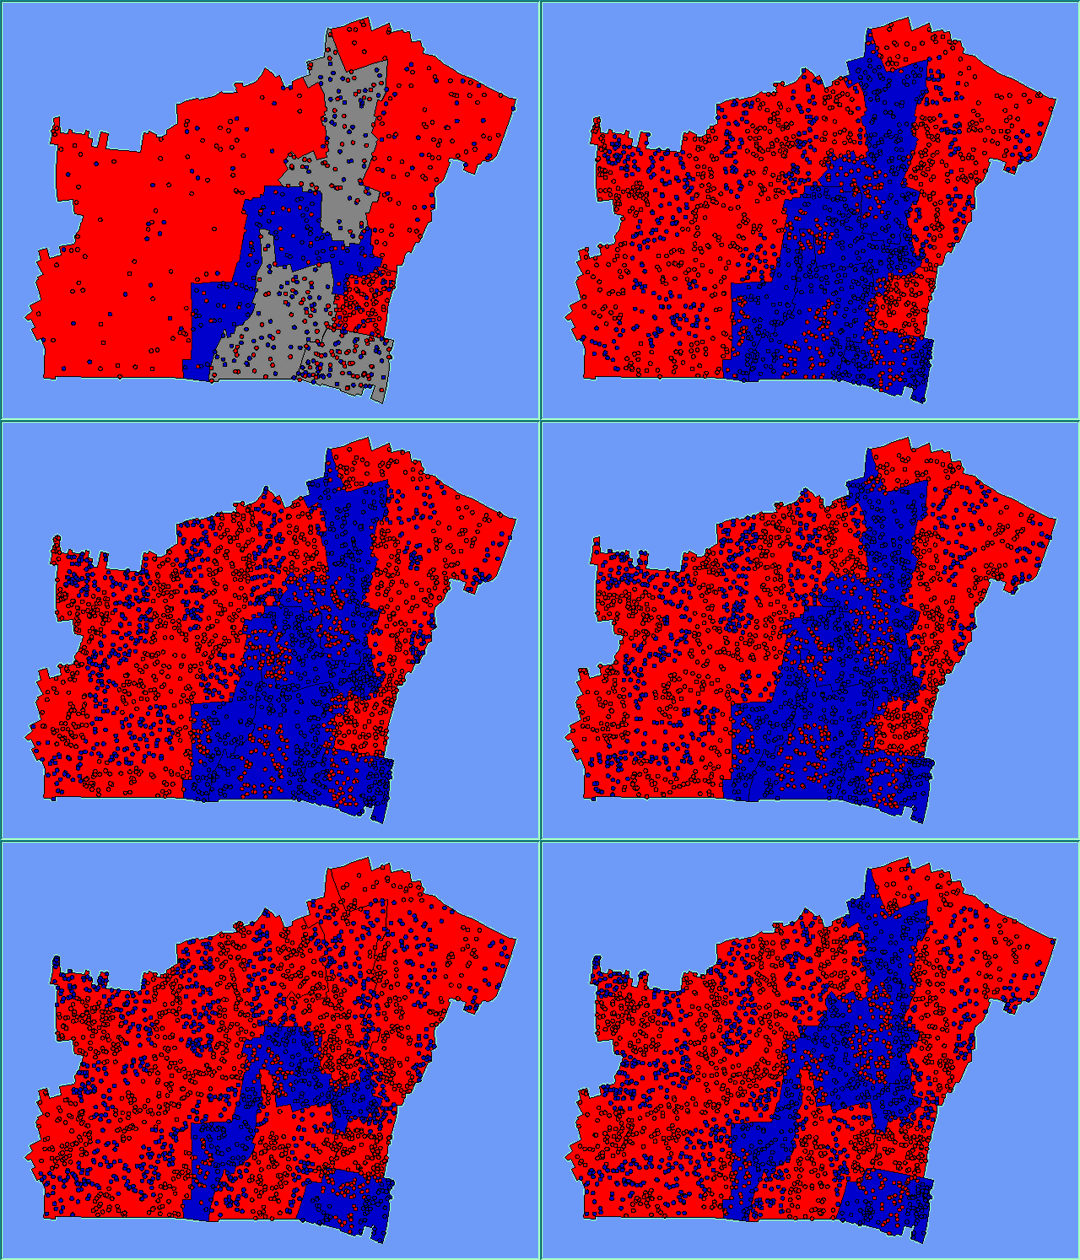
Within this test, agents are both added and removed from the system either because they are dissatisfied or die. The initial population was 700 agents (390 of type red (55.7%) and 310 of type blue (44.3%)). These agents were spread over several polygons as highlighted in Figure 1. Within the area, there were 3 areas where the predominant social group was red (i.e. 70% of the population was red), 1 area where the predominant social group was blue (70%) and 3 areas were classified as mixed (population composed of 50% of both groups). 100 new agents are added to the system at the end of each iteration and removed (when they reach the age of 50). As in previous models, each agent wanted to be in an area where 50% or more of its neighbours are of the same type. Neighbourhoods were defined as 100m radius.
Figure 1: Initial starting conditions for the simulations with agents distributed randomly within their areas.
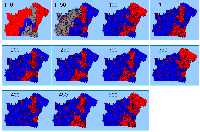
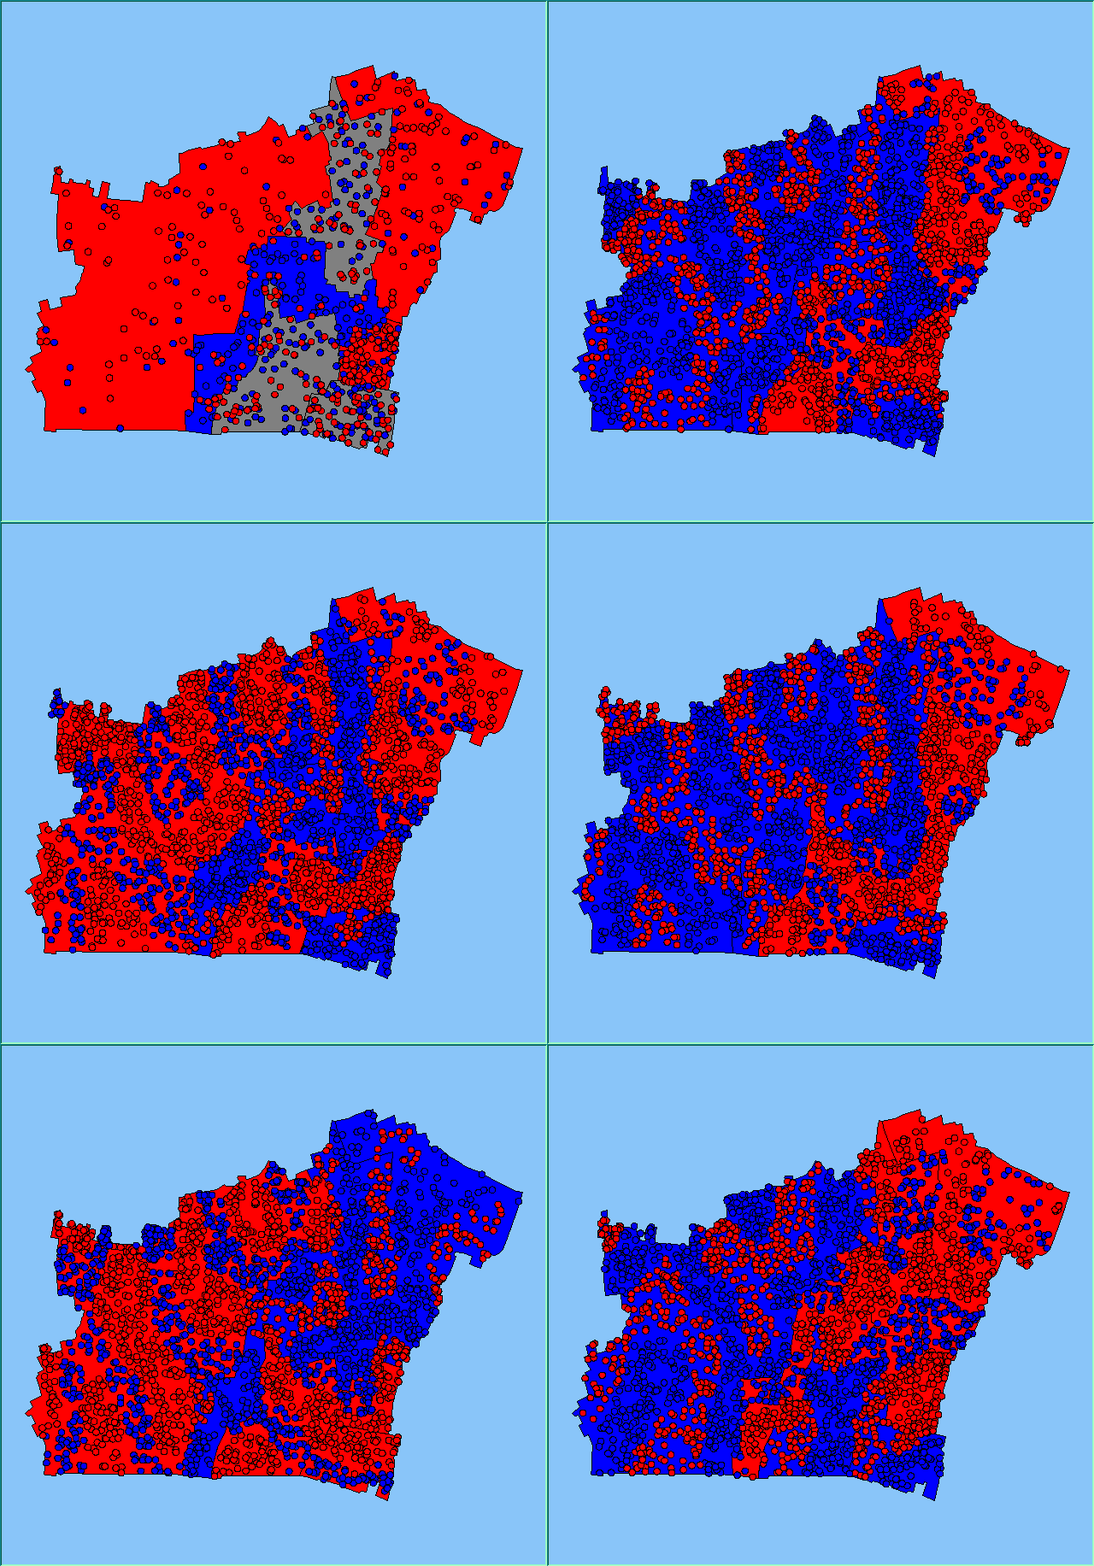
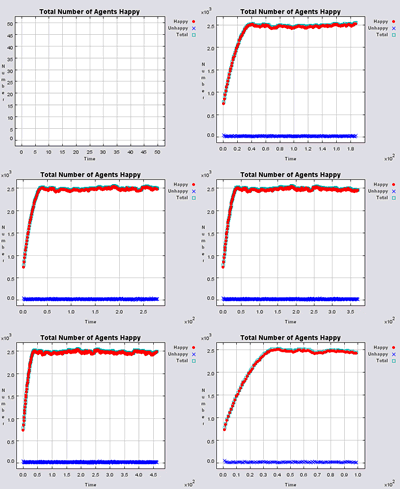
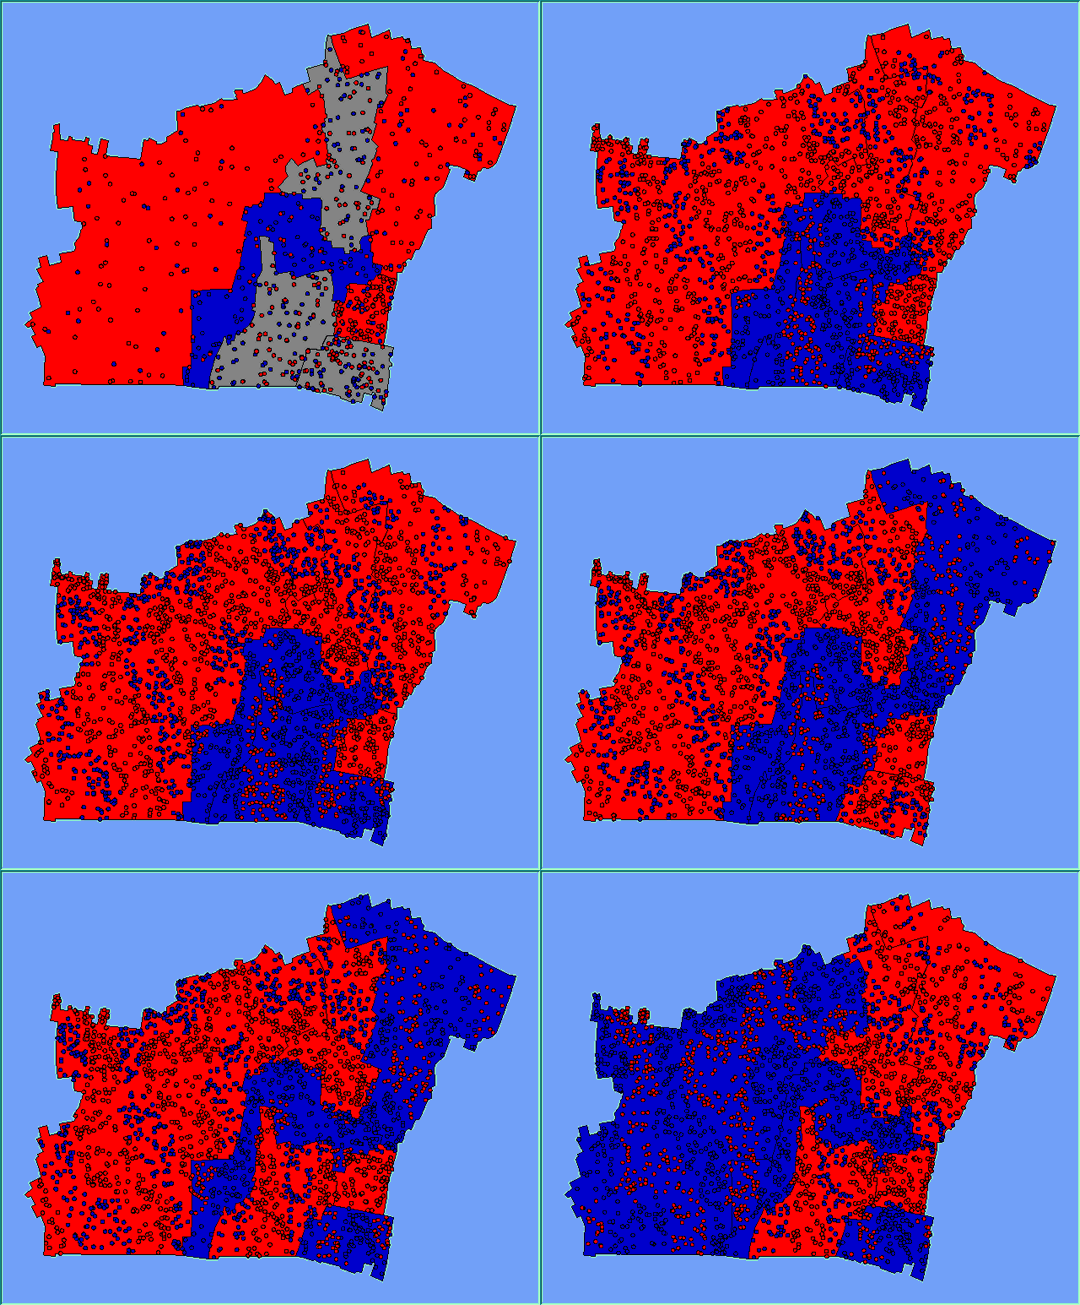
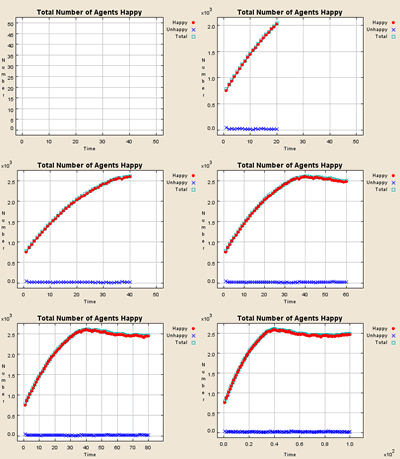
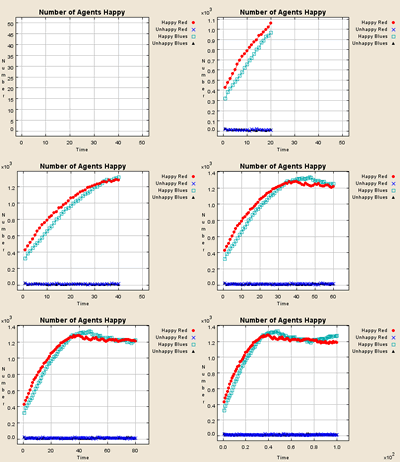
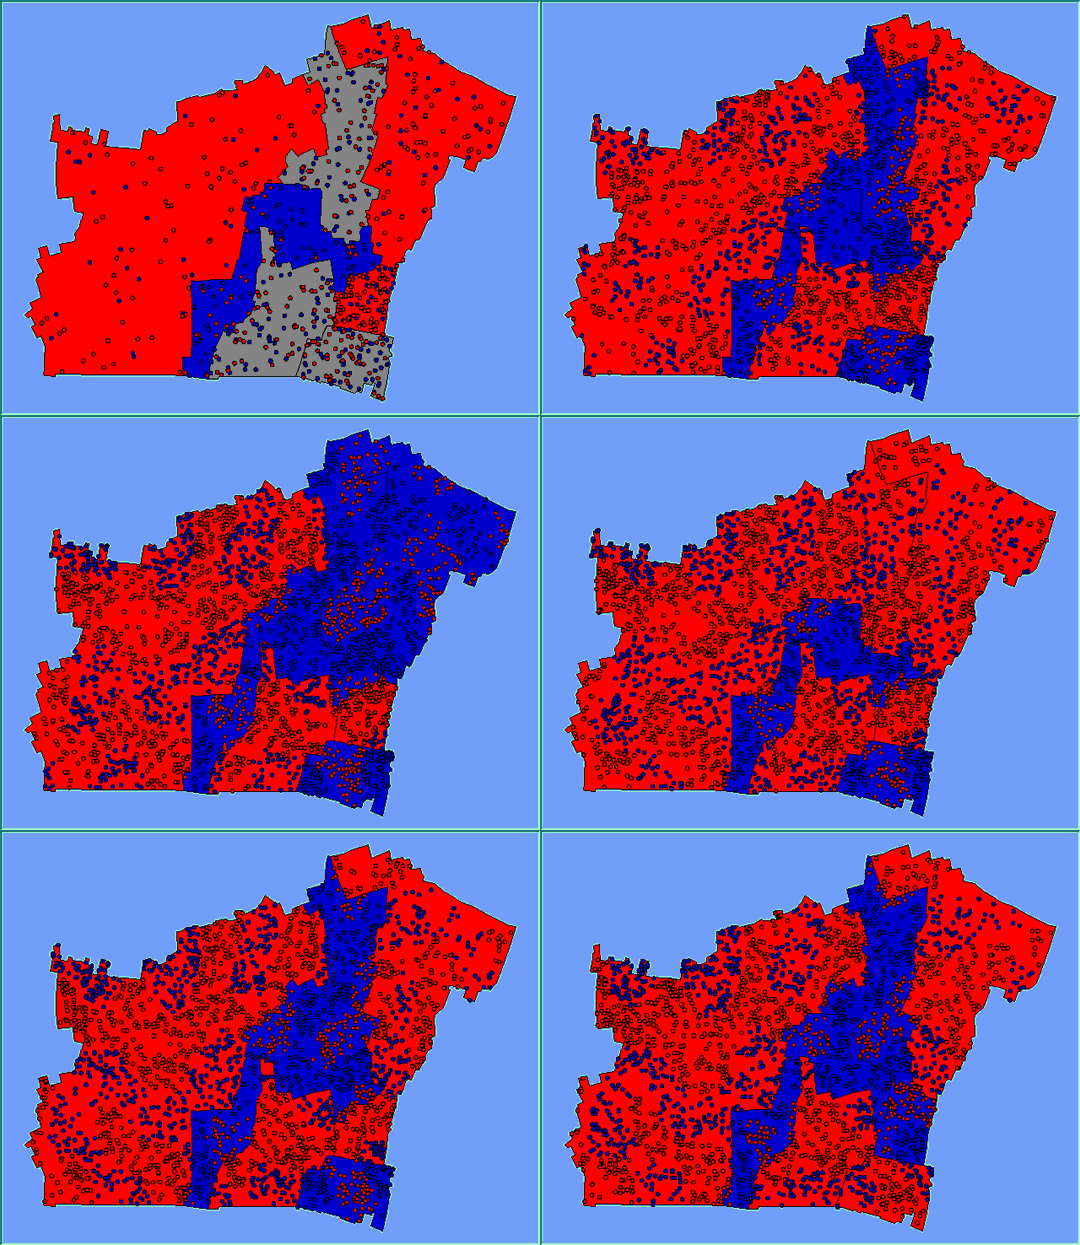
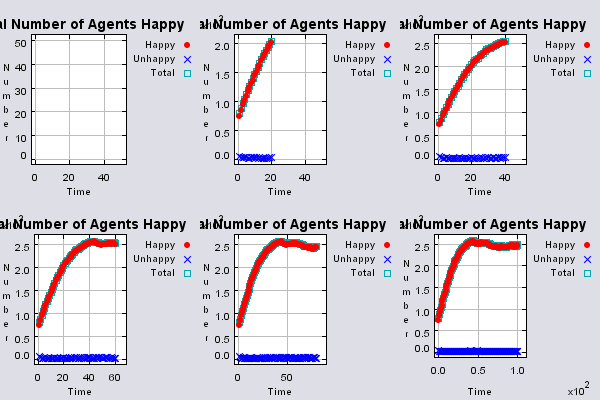
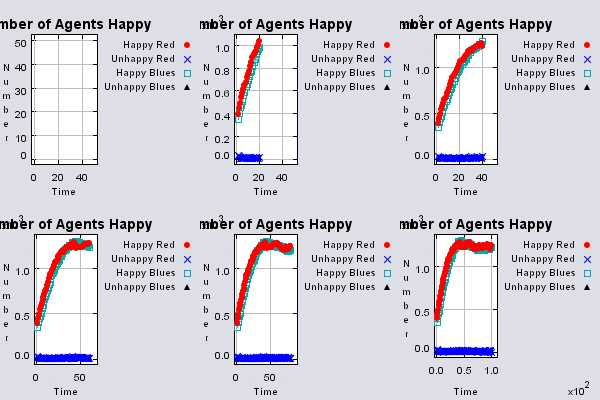
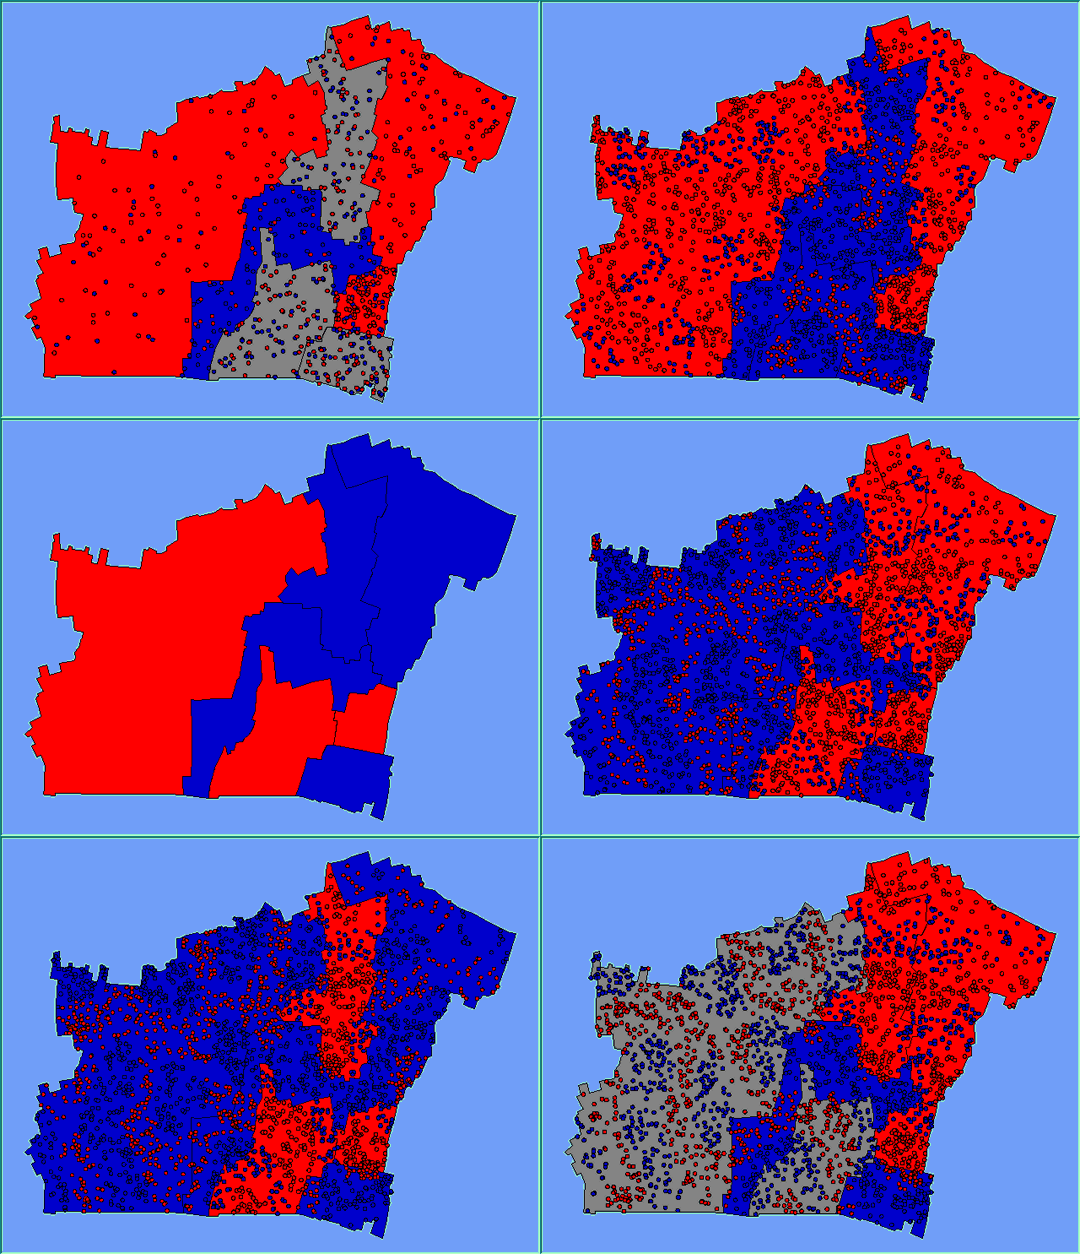
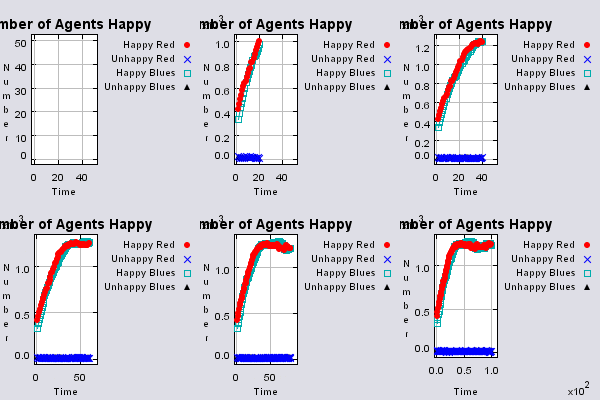
By 100 iterations the number percentage of both red and blue agents becomes roughly equal (see Table 1) and remains roughly constant however the degree to which one group predominates one area varies over the course of each simulation as agents are added and removed due to dying (in no instances are agents removed because they could not become satisfied with an area). Figure 2 traces a typical simulation, from the initial starting condition, and the pattern at every 50 iterations thereafter, to the pattern at the end of the simulation. As agents are added and removed from the system, the predominant social groups of the areas change as can be seen from the underlying polygon colour in Figure 2. Red represents an area where its population is 51% red, blue areas are areas where 51% or more of the population are blue and grey represents equal numbers of red and blue agents.
Additionally Figure 2 highlights how clusters of groups do not stop at boundaries of areas. So while the aggregate data suggests that the area is predominantly of one type, clusters of distinct groups appear throughout the area and cross the boundaries between areas. These clusters would have been lost by purely using aggregate information. Even in the case where one area contains equal numbers of red and blue agents, distinct patterns of segregation are noticeable. Animations of these simulation runs where agents were added and removed can be seen below.
Table 1: Results from simulations where agents where both added and removed.
Figure 2: The effect of adding and removing agents to the system and the resulting patterns of segregation.
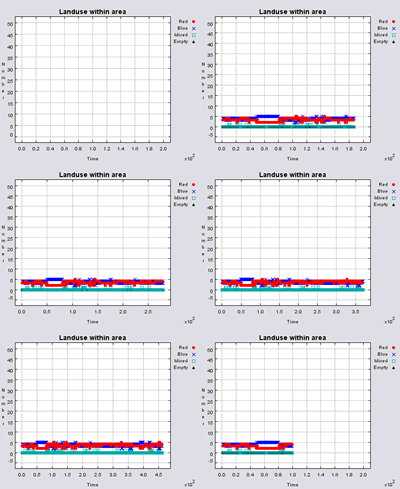
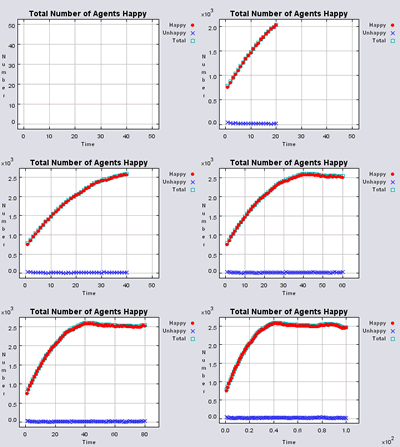
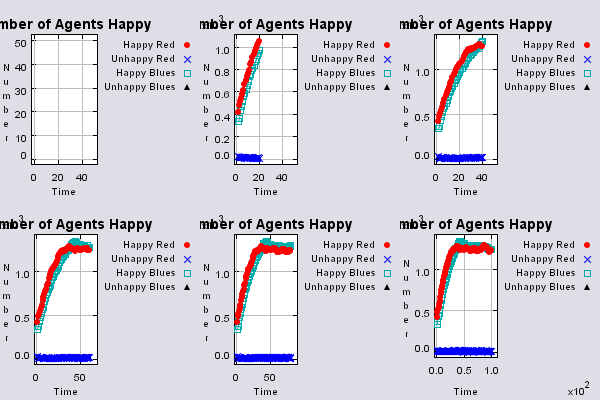
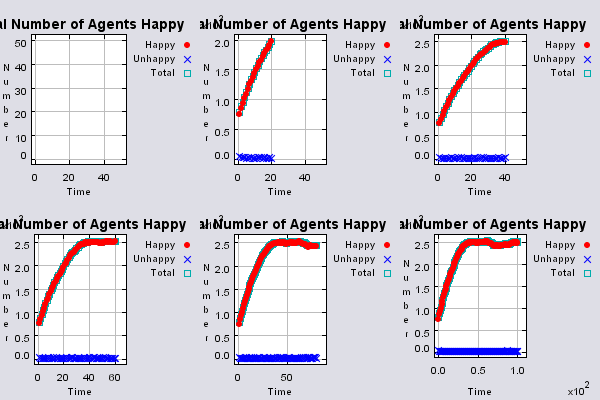
Animations of simulation runs where agents were added and removed up to 100 iterations
 |
 |
 |
|
 |
 |
 |
|
 |
 |
 |
|
 |
 |
 |
|
Animation of simulation runs where agents were added and removed up to 500 iterations |
|
|
|
Reference
Fossett, M. and Waren, W. (2005), 'Overlooked Implications of Ethnic Preferences for Residential Segregation in Agent-Based Models', Urban Studies, 42(11): 1893-1917.
Portugali, J. (2000), Self-Organization and the City, Springer-Verlag, Berlin, Germany

