The Segregation Model | Models within Paper | Small Minority Population
The simulations presented above have presumed 50/50 populations, which is rarely the case within cities. Often within populations, there are small minority groups which cluster in specific areas of the city; for example within London, the Bangladeshi population made up 2.1% (153900) of London’s population (7172091) in 2001 (Greater London Authority, 2005) but of all the Bangladeshi population, 43% (65553) live within Tower Hamlets (Greater London Authority, 2004). The ability to model more than two groups allows one to explore differences between the numbers of dominant and subdominant groups within a population.
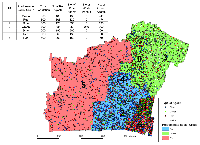
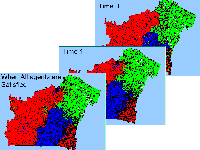
The following section explores a population of 4200, comprised of 37% red, 34% blue, 24% green and 5% white agents over 7 polygons (Figure 1). The white agents are only located in one area as highlighted in Figure 12. The first experiment was to see how this minority population group can change over a course of a simulation run. The experiment was carried out several times to explore how the pattern of segregation develops as the agents search for neighbourhoods where 50% or more of their neighbours are of the same types as themselves. Figure 2 highlights a typical simulation run with the majority of the white population staying in the same area when all agents are satisfied as they originated in (Click here to see some sample animation). The number and type of predominant social groups in the area are on average the same as the model was first initialised (Table 1).
Figure 1: Initial starting conditions for the simulations where 5% of the population is white and agents are distributed randomly within their areas.
Figure 2: A typical simulation portraying the initial, first and last iteration until all agents are satisfied when only 5% of the population is white (Click here to see animations).
Table 1 Average iterations until all agents are satisfied when only 5% of the population is white.
The next experiment was to explore how new agents affect this pattern of segregation. As with the previous experiment, the same initial conditions and preferences are used (Figure 1). However, within this experiment, 200 new agents were added at the end of each iteration and the model was run for 50 iterations (see Addition and Removal of Agents for a description of how the agents were added).
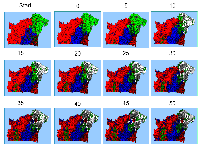
By the end of 50 iterations, the average land-use was red having the largest percentage in 3 areas and the blue and white agents making up the largest percentage in 2 areas each (Table 2). It is noticeable that when the model was first initialised there were 2 green areas. However, over the course of the simulation runs as new agents are added, the green agents’ dominance declines as white agents occupy the areas where the greens were once predominant. The white areas tended to be in the top right polygon where the initial white population was concentrated and in one of the adjacent polygons as its population grew. Figure 3 highlights a typical simulation run, showing how clusters develop during the simulation. Generally the addition of new agents reinforces clusters. This is particularly the case where the white agents are clustered in one area. This area attracts new white agents forcing the area to grow and spill over to adjacent areas, reinforcing the predominant social group in the area and specifically forcing the green agents to lose their dominance in these areas.
Figure 3: A typical simulation portraying every 5 time intervals where agents are being added when only 5% of the initial population is white (Click here to see animations).
Table 2: Average results when the initial population only contains 5% white and agents are added for 50 iterations.
References
Greater London Authority (GLA) (2004), 2001 Census Profiles: Bangladeshis in London, Greater London Authority, London, UK.
Greater London Authority (GLA) (2005), London - The World in a City: An Analysis of 2001 Census Results, Greater London Authority, London, UK.


