The Segregation Model | Models within Paper | Size of Neighbourhoods
- Source Code (729 KB)
- Shapefile (4.06 KB)
Neighbourhoods mean different things to different people. Some may perceive a neighbourhood as houses that are directly attached to their home (e.g. Benenson et al., 2002 model), while others may consider a street, or a collection of streets as their neighbourhood. Schelling (1971) presented two models with regard to neighbourhoods: one based on their immediate eight surrounding cells (Moore neighbourhood) and a second on a larger area – his ‘bounded neighbourhood’ model.
As the model does not operate on cellular space, neighbourhoods are not calculated using the traditional Moore or von Newman neighbourhoods or variations of these. As already stated, neighbourhoods within the model are calculated using a buffer at a specified radius around the agent (see Neighbourhood Calculations Section in Segregation model). To test the influence of neighbourhood size (which some class as vision e.g. Laurie and Jaggi, 2003; Fossett and Waren, 2005) on the resulting pattern of segregation that emerges, various neighbourhood sizes were tested ranging from 50m to 1000m. All the other parameters within the simulations were kept the same: 4000 agents were randomly placed, 2000 of each colour within a 1.5km2 area. All agents desire to be in a neighbourhood where 50% or more of their neighbours are of the same type. Increasing the neighbourhood size could be considered as a way of exploring both of the models that Schelling (1971) presented. As the smallest neighbourhood would only encompass the agents immediate neighbours, if an agent was dissatisfied with the area, this would reflect the composition of the agent’s immediate neighbours. For larger neighbourhoods, agents would consider larger areas with the agent not considering its immediate neighbours per se but its overall neighbourhood composition.
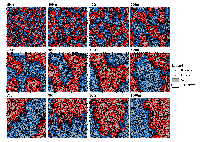
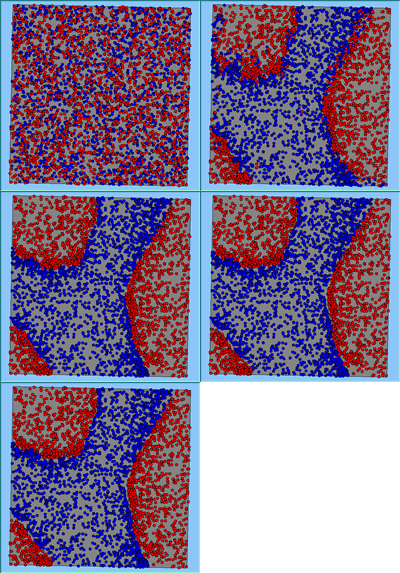
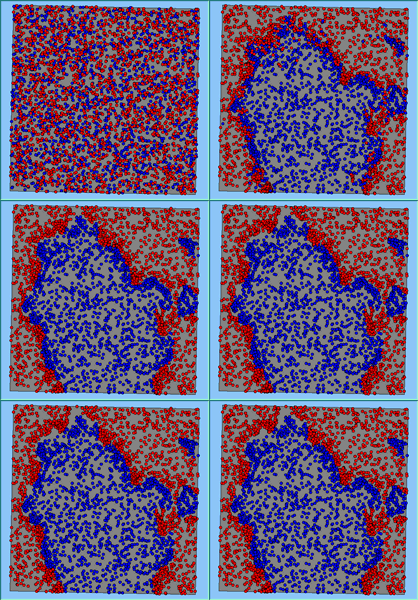
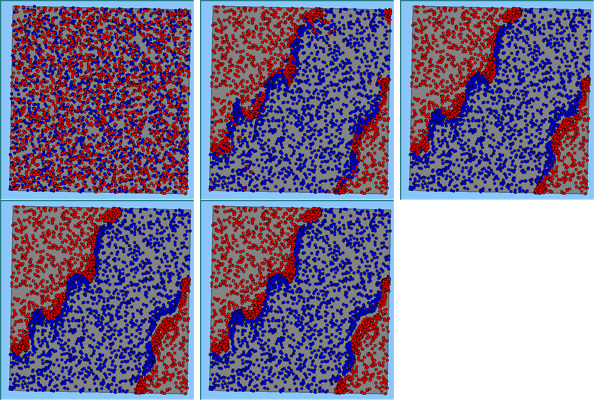
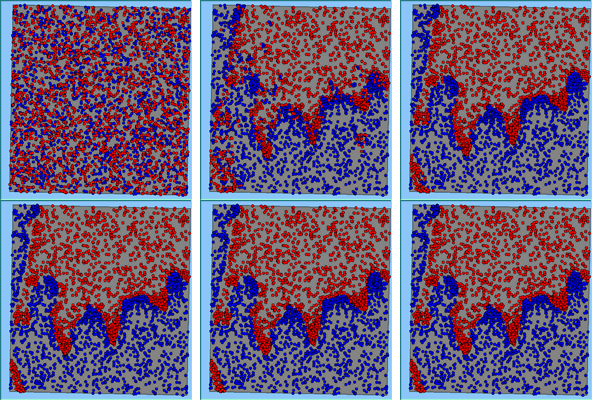
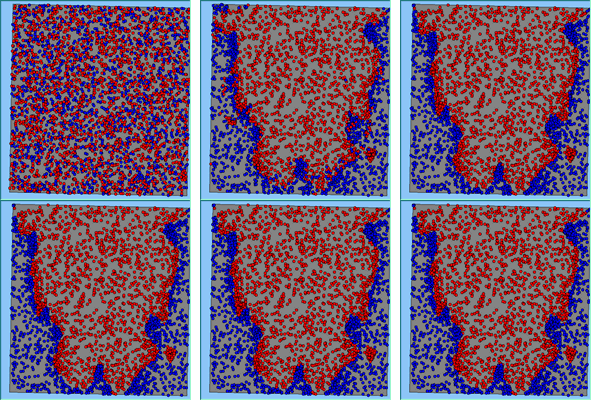
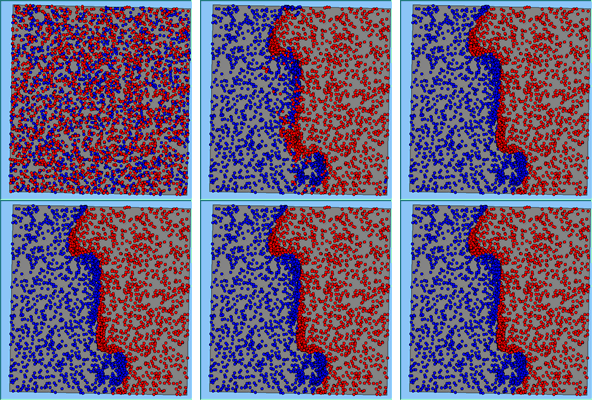
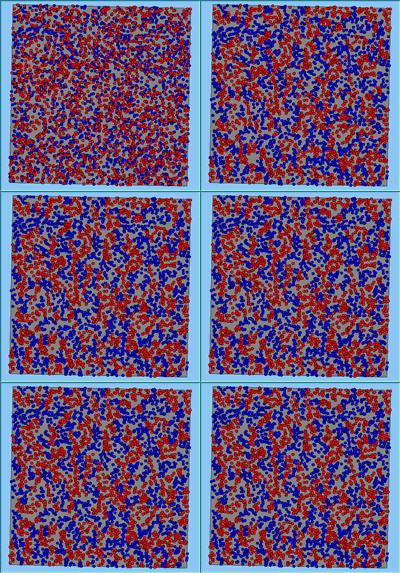
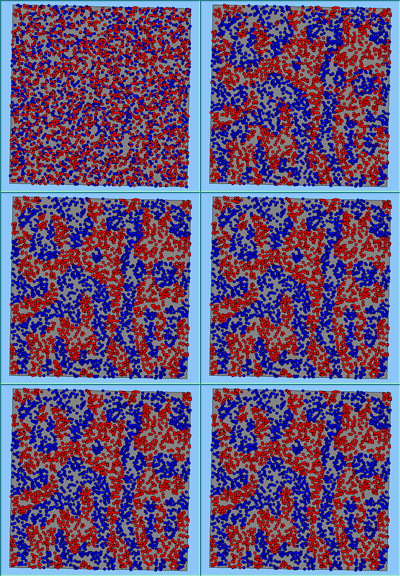
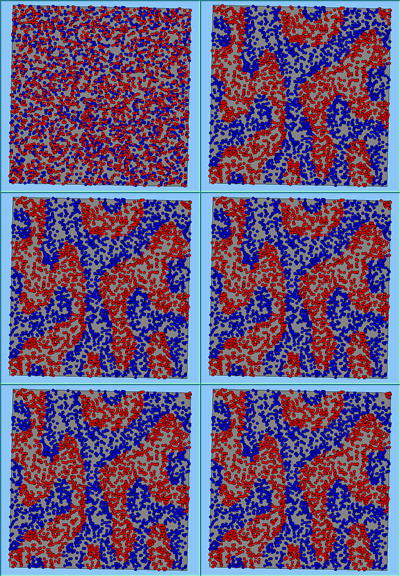
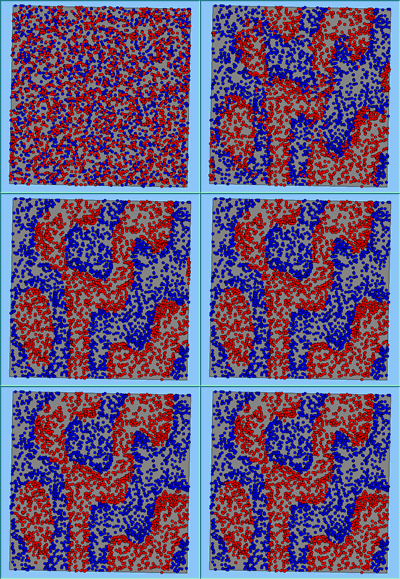
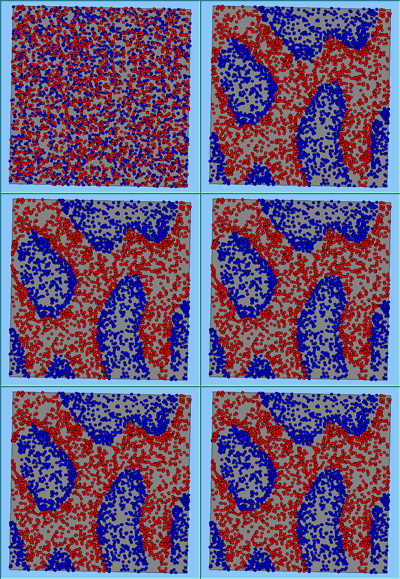
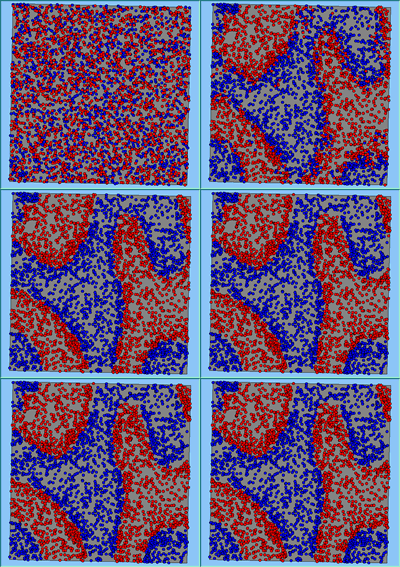
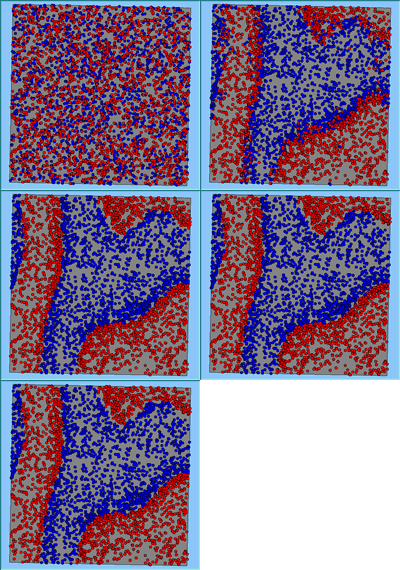
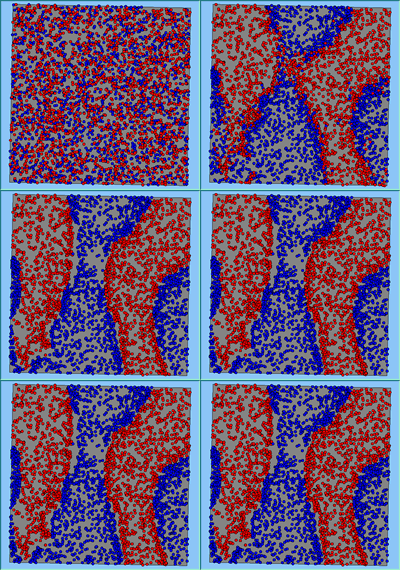
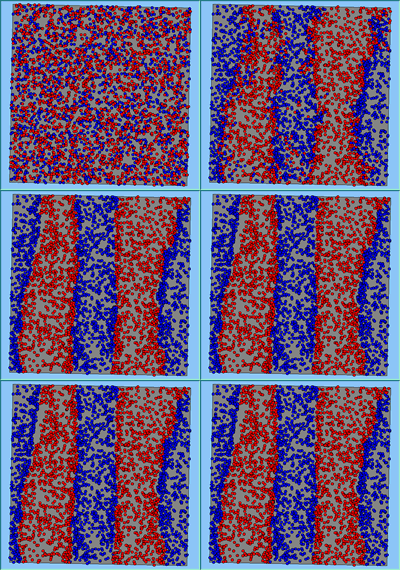
Typical patterns of segregation resulting from different neighbourhood sizes are presented in Figure 1 which clearly shows the influence of neighbourhood size on the outcome of the pattern of segregation. Animations of these simulation runs can be seen below. Smaller neighbourhood sizes result in small segregated areas and larger neighbourhoods result in larger segregated areas in proportion to the size of the buffer used. Another feature of the model is that at the boundary of these neighbourhoods, agents appear to be more clustered than those in the centre of the neighbourhood (this effect can be explored further in Segregation Density model)..
Figure 1: Screen captures of segregation outputs when all agents are satisfied for different neighbourhood sizes.
From an examination of the summary statistics from the model runs (Table 1), the total number of moves agents made during a simulation, while being dependent upon the initial neighbourhood configuration, increases with neighbourhood size. This is especially the case for the number of agents that do not move during the course of the simulation and those agents that move more than once. As agents only move to areas in which they are satisfied, for agents to move more than once, their neighbourhood would have to have changed.
Table 1: Comparison of neighbourhood size, number of iterations and number of moves until all agents are satisfied.
Animations of simulation runs
 |
 |
 |
|
 |
 |
 |
|
 |
 |
 |
|
References
Benenson, I., Omer, I. and Hatna, E. (2002), 'Entity-Based Modelling of Urban Residential Dynamics: The Case of Yaffo, Tel Aviv', Environment and Planning B: Planning and Design, 29(4): 491-512.
Fossett, M. and Waren, W. (2005), 'Overlooked Implications of Ethnic Preferences for Residential Segregation in Agent-Based Models', Urban Studies, 42(11): 1893-1917.
Laurie, A.J. and Jaggi, N.K. (2003), 'Role of 'vision' in Neighbourhood Racial Segregation: A Variant of the Schelling Segregation Model', Urban Studies, 40(13): 2687–2704.
Schelling, T.C. (1971), 'Dynamic Models of Segregation', Journal of Mathematical Sociology 1: 143-186.

